New on the MARCO Ocean Data Portal
The Portal Team has published hundreds of maps in the first quarter of 2020 showing recent and future fish habitat shifts (see feature article), surface currents, sea turtle and diving bird migration routes and more.
Surface Currents: The Portal has published its first series of map layers showing typical sea surface current patterns for each season in Mid-Atlantic and southern New England waters. The maps are the latest data products developed through a partnership between the Mid-Atlantic Regional Association Coastal Ocean Observing System (MARACOOS) and MARCO.
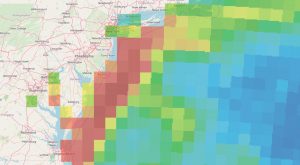
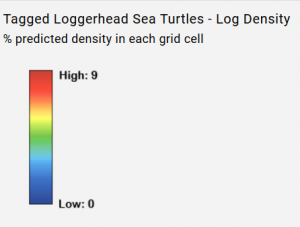
Loggerhead Sea Turtles: In partnership with the NOAA Northeast Fisheries Science Center and the Northeast Ocean Data Portal, 12 new map layers showing the monthly densities of tagged loggerhead sea turtles throughout southern New England and the Mid-Atlantic Bight have been added. Users can toggle through the maps manually or animate them automatically.
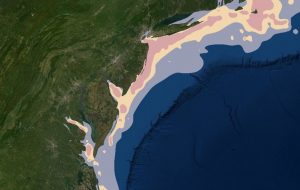
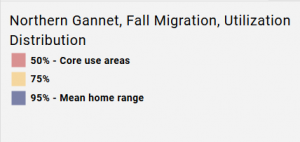
Diving Bird Migration Routes: In partnership with the U.S. Fish & Wildlife Service and the Bureau of Ocean Energy Management, nine new map layers showing the core use areas of three diving bird species – the northern gannet, red-throated loon, and surf scoter – during spring migration, fall migration and winter, have been published on the Portal. The maps can be found by clicking on the Bird Seasonal Migration and Utilization Distribution dropdown in the Portal’s Marine Life theme. The birds are all considered species of conservation concern and also exhibit traits that may make them vulnerable to the adverse effects of offshore wind development.
Electric Transmission Lines: This map layer shows the routes of above-ground, underground and submarine power lines throughout the Mid-Atlantic and Northeast regions. Line voltages are represented by varying colors and widths. Users can click on a line for a pop-up containing additional information. The map can be found within Marine Planner’s Renewable Energy theme.
Electric Substations: This map layer shows the locations of electric substations with voltages of 69 kilovolts or higher throughout the Mid-Atlantic and Northeast. Voltage levels are represented by varying colors, and larger squares indicate facilities with higher capacities. Users can click on sites for pop-ups containing additional information about individual substations. The map can be found within Marine Planner’s Renewable Energy theme.
Submarine Canyons: This previously created map layer outlines the general areas of the Mid-Atlantic’s major canyons. Users can click on any shape for a pop-up containing the canyon name. The layer has been updated to include the following additional canyons (from south to north): Leonard, Phoenix, Warr, South Vries, North and South Heyes, Uchupi and McMaster.
North Carolina PARS: A new map showing the focus area for a North Carolina Port Access Route Study (NCPARS) being led by the U.S. Coast Guard is now available in Marine Planner. The NCPARS is being conducted to determine whether existing or additional vessel routing measures are necessary along North Carolina’s coast and in the approaches to the Cape Fear River and Beaufort Inlet.
The list above includes just a sample of our recent improvements. Check the Portal blog for the latest and most comprehensive look at data additions and tool enhancements.
Share this: