Mid-Atlantic Hurricane Tracks, Offshore Wind Speed Maps Added to Mid-Atlantic Ocean Data Portal
MARCO Ocean Data Portal users can now retrace the paths of the most powerful Mid-Atlantic storms of the last 40 years and view animations showing how offshore wind speeds change throughout the year. Take a look at some of our latest data and content below.
- Historic Hurricanes: A series of maps were added showing hurricane paths along the East Coast from 1980 to the present day. One of the maps shows the combined paths for all named storms and allows users to click on any point along the track line for a pop-up window containing information about the storm, such as its date range and top wind speeds. Alternatively, users can toggle through or animate maps showing the storms by decade.
- Monthly & Annual Wind Speeds: Learn which offshore areas tend to experience the strongest winds each month or all year round with a collection of 13 new maps in the Portal’s Oceanography theme. Both the Monthly Offshore Wind Speed Slider and Annual Offshore Wind Speed layers cover the full Atlantic Coast and extend from the shoreline beyond the continental shelf break in the Mid-Atlantic.
- Intro to the Portal: Our September “How Tuesday” webinar provided an introductory overview of the Portal’s data and tools.
Share this:


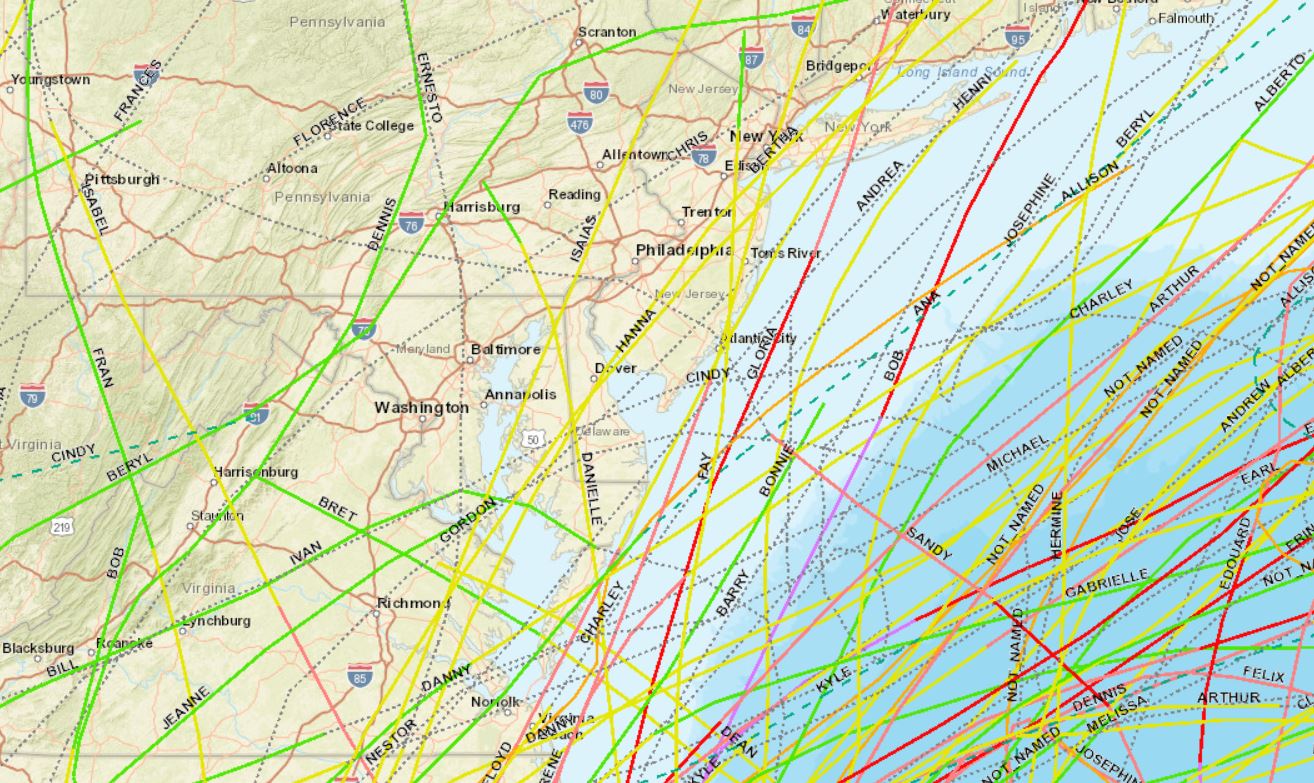
Historic Hurricane Tracks
Credit: Mid-Atlantic Ocean Data Portal
Share this: